Create diagnostic observation variance v.s. CV plot.
obscv.plot.RdPlot the estimated observation variance of each data source in the assessment agains the CV of the estimate.
obscv.plot(sam)Arguments
- sam
An FLSAM assessment output object
Details
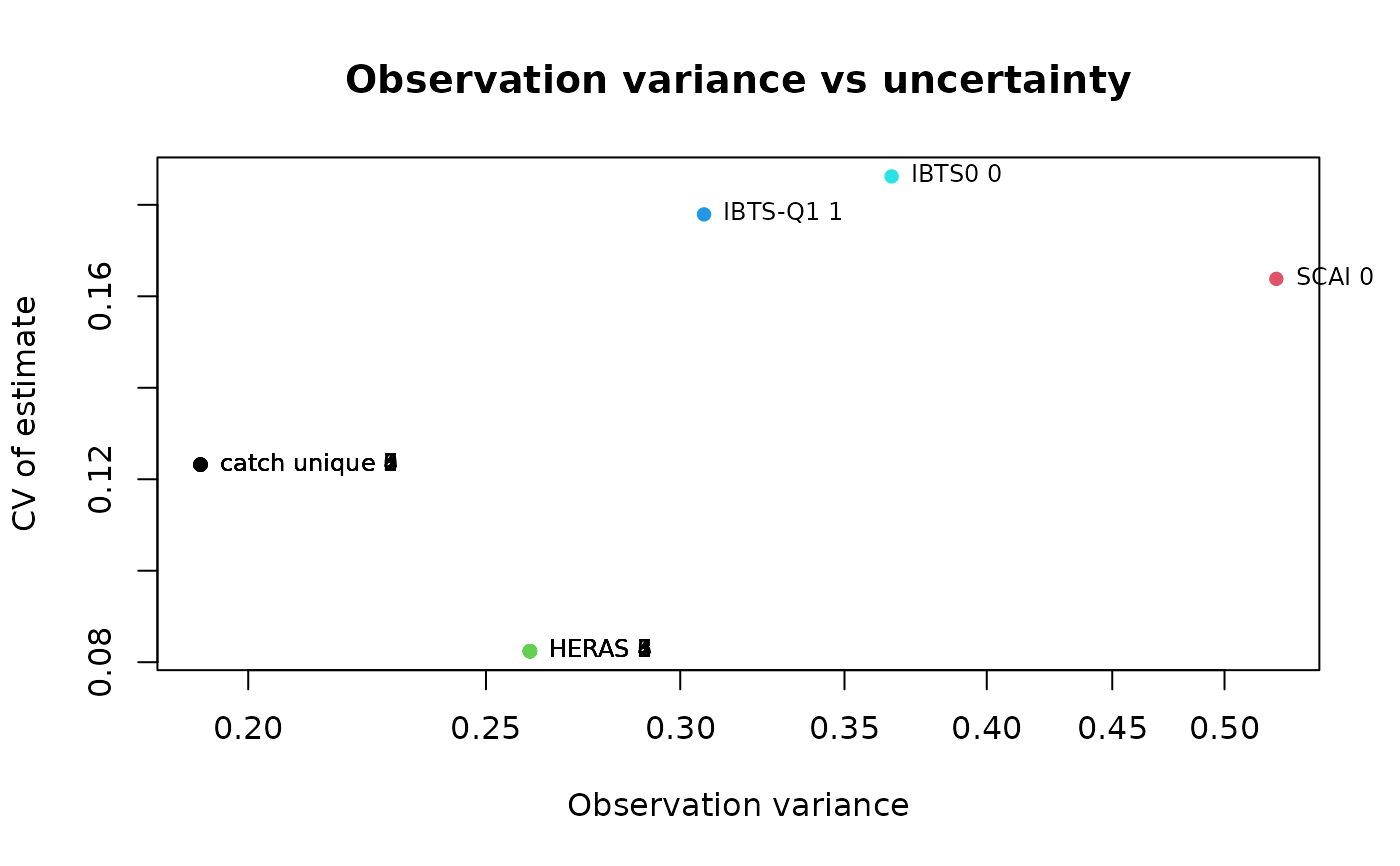
This plot can be used as rough and ready way to gauge how "tightly" the SAM model has converged on the observation variances. In cases where the observation variances are poorly defined, the associated CV of the estimate will be large. In such cases, the model convergence should be examined in more detail.
Value
A plot is returned with on the horizontal axis the observation variance of each data source versus on the vertical axis the CV estimate associated with the data source
See also
Examples
data(NSH.sam)

obscv.plot(NSH.sam)