Implementation of Trellis graphics in FLR
Usage
# S4 method for formula,FLQuant
xyplot(x, data, ...)

# S4 method for formula,FLCohort
xyplot(x, data, ...)

# S4 method for formula,FLQuants
xyplot(x, data, ...)

# S4 method for formula,FLComp
xyplot(x, data, ...)

# S4 method for formula,FLQuant
bwplot(x, data, ...)

# S4 method for formula,FLComp
bwplot(x, data, ...)

# S4 method for formula,FLQuant
dotplot(x, data, ...)

# S4 method for formula,FLComp
dotplot(x, data, ...)

# S4 method for formula,FLQuant
barchart(x, data, ...)

# S4 method for formula,FLComp
barchart(x, data, ...)

# S4 method for formula,FLQuant
stripplot(x, data, ...)

# S4 method for formula,FLComp
stripplot(x, data, ...)

# S4 method for formula,FLQuant
histogram(x, data, ...)

# S4 method for formula,FLComp
histogram(x, data, ...)

# S4 method for formula,FLQuants
histogram(x, data, ...)

# S4 method for formula,FLPar
densityplot(x, data, ...)
Details
Plot methods in the lattice package are available for
an object of classes FLQuant, FLQuants or those derived from
FLComp.
See the help page in lattice for a full description
of each plot method and all possible arguments.
Plot methods from lattice are called by passing a data.frame obtained by converting the FLR objects using as.data.frame. For details on this transformation, see as.data.frame-FLCore.
Generic function
barchart(x, data, ...)
bwplot(x, data, ...)
densityplot(x, data, ...)
dotplot(x, data, ...)
histogram(x, data, ...)
stripplot(x, data, ...)
xyplot(x, data, ...)
Examples
data(ple4)
# xyplot on FLQuant
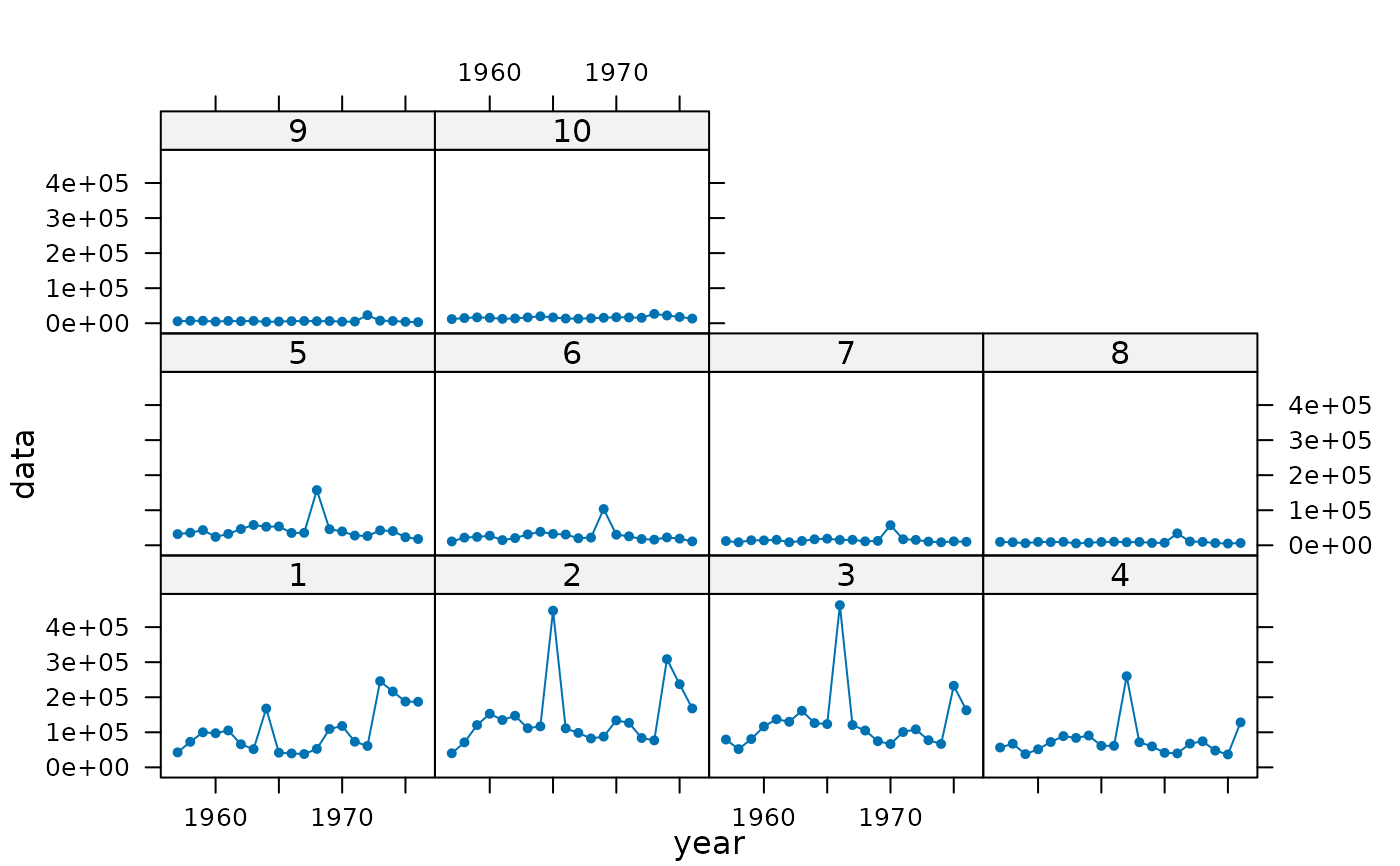
xyplot(data~year|age, catch.n(ple4)[, 1:20])
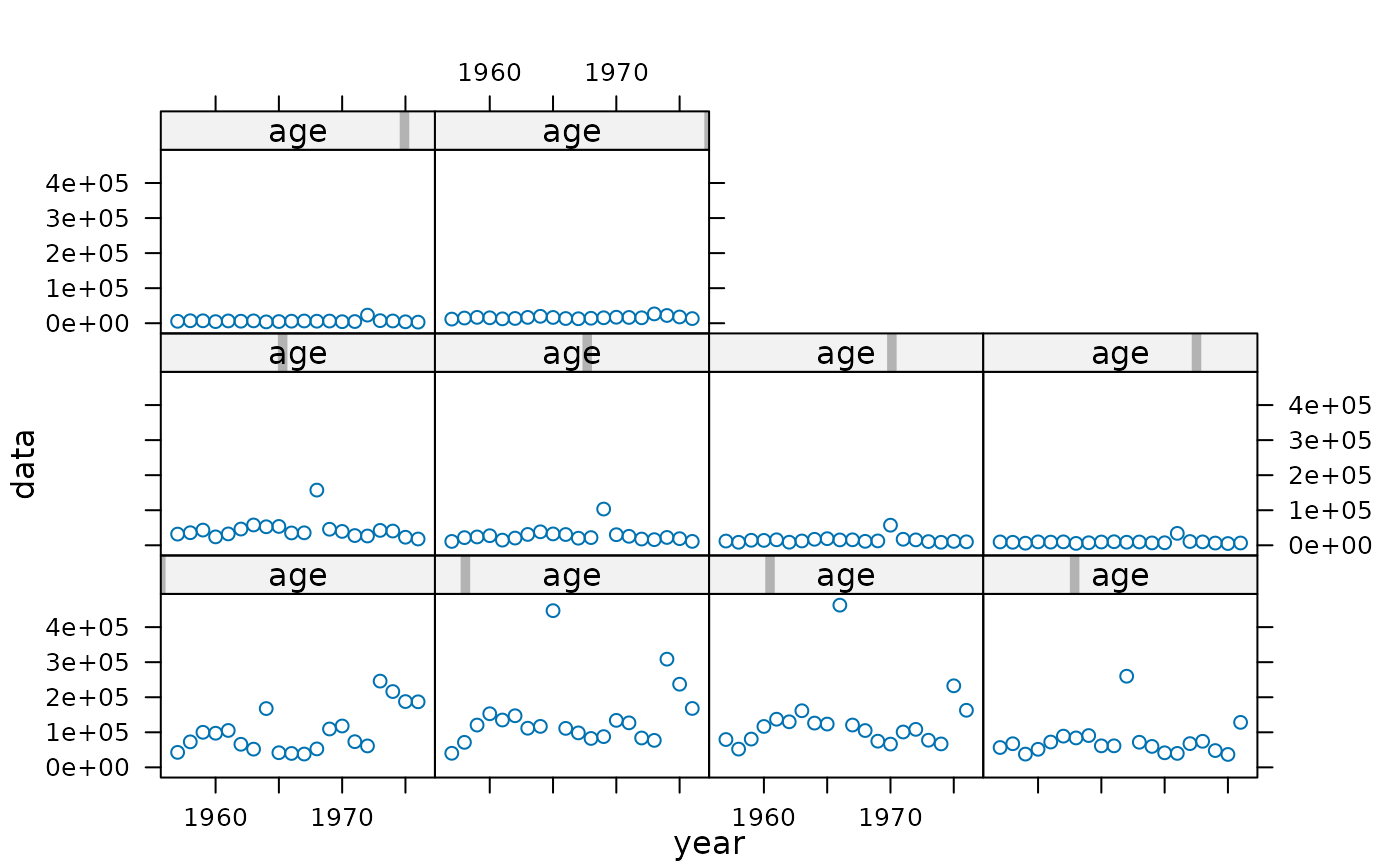 xyplot(data~year|as.factor(age), catch.n(ple4)[, 1:20], type='b', pch=19,
cex=0.5)
xyplot(data~year|as.factor(age), catch.n(ple4)[, 1:20], type='b', pch=19,
cex=0.5)
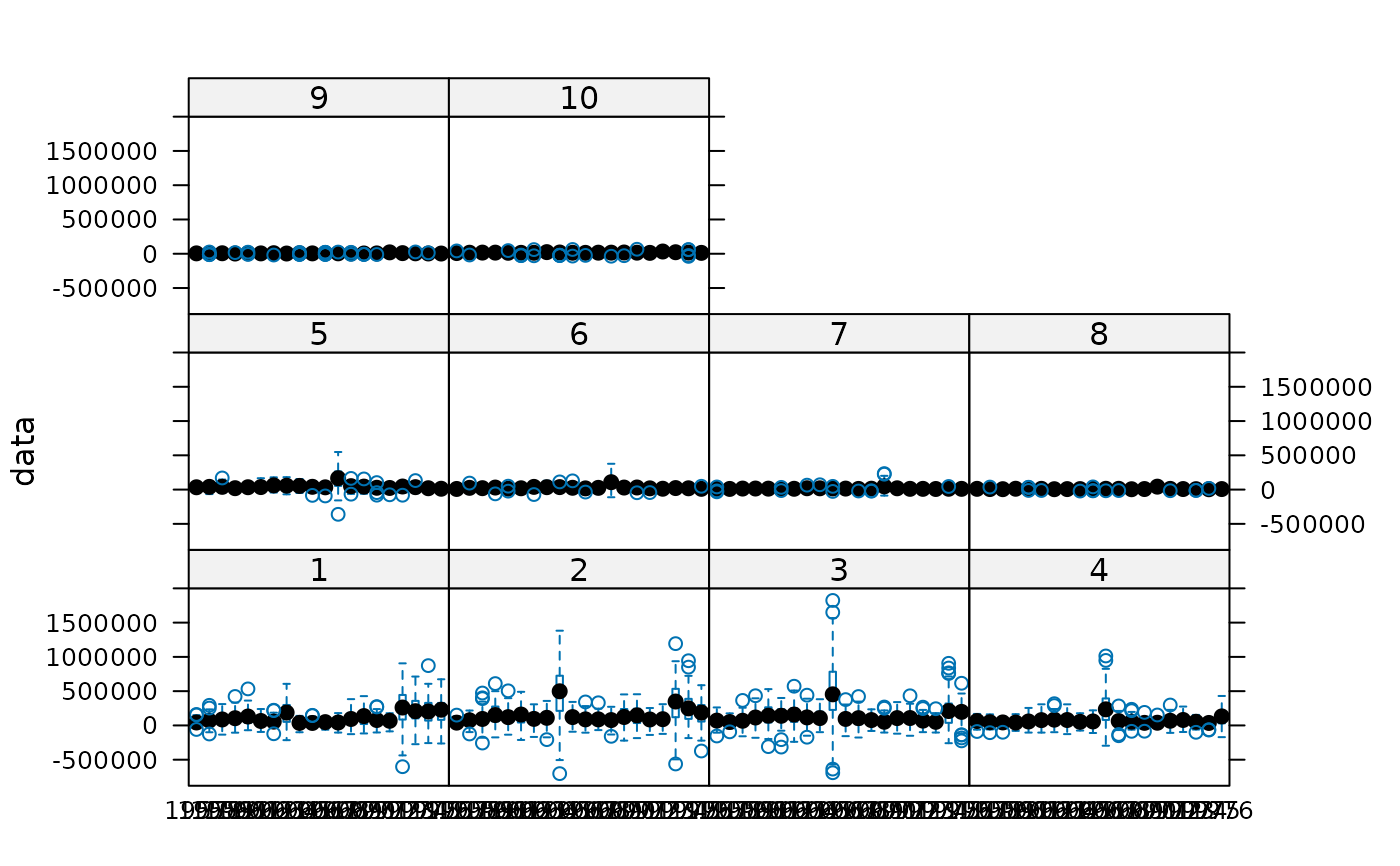
 # bwplot on FLQuant with iter...
flq <- rnorm(100, catch.n(ple4)[, 1:20], catch.n(ple4)[,1:20])
bwplot(data~year|as.factor(age), flq)
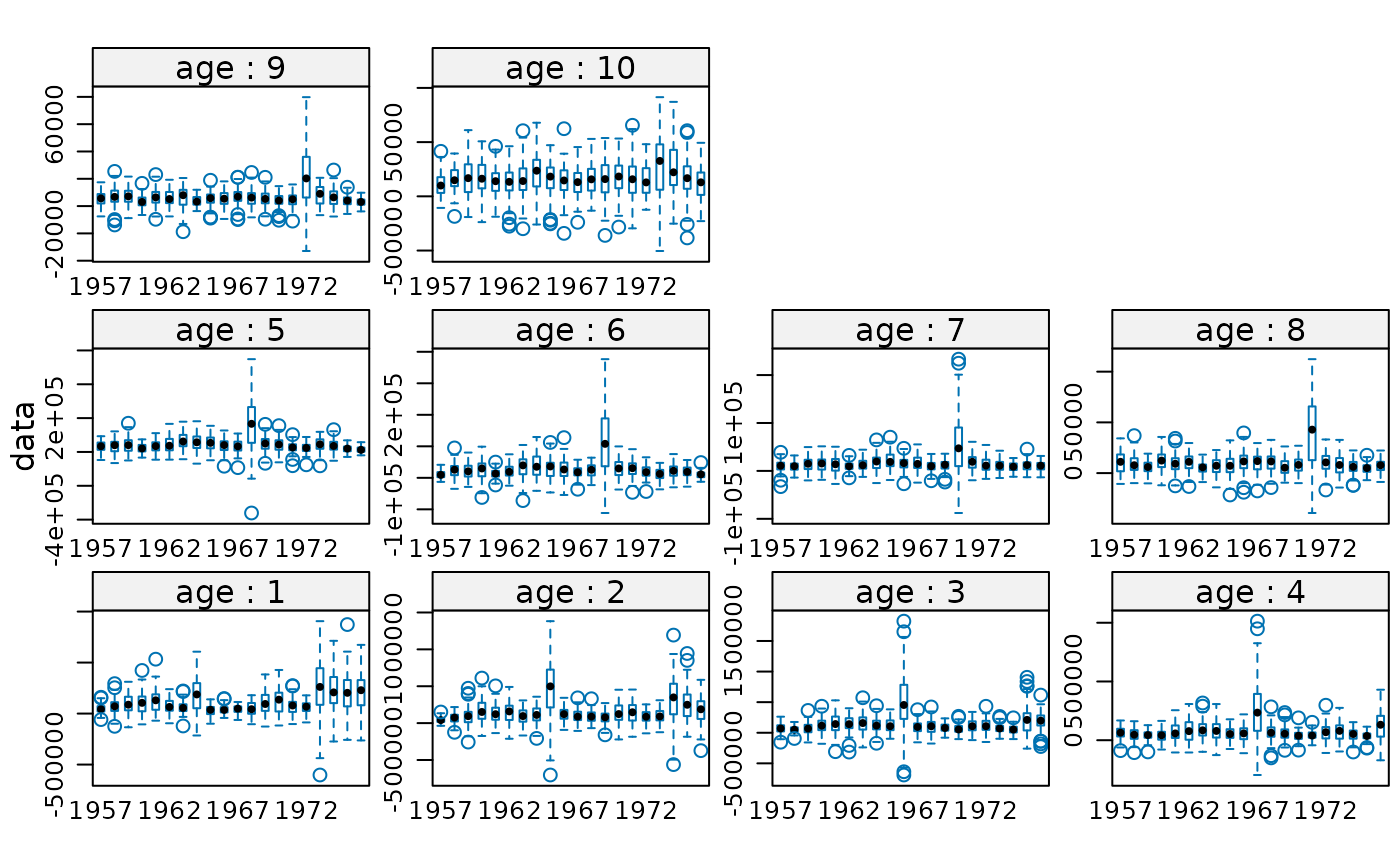
# bwplot on FLQuant with iter...
flq <- rnorm(100, catch.n(ple4)[, 1:20], catch.n(ple4)[,1:20])
bwplot(data~year|as.factor(age), flq)
 # ...now with same style modifications
bwplot(data~year|as.factor(age), flq, scales=list(relation='free',
x=list(at=seq(1, 20, by=5),
labels=dimnames(catch.n(ple4)[,1:20])$year[seq(1, 20, by=5)])),
cex=0.5, strip=strip.custom(strip.names=TRUE, strip.levels=TRUE,
var.name='age'))
# ...now with same style modifications
bwplot(data~year|as.factor(age), flq, scales=list(relation='free',
x=list(at=seq(1, 20, by=5),
labels=dimnames(catch.n(ple4)[,1:20])$year[seq(1, 20, by=5)])),
cex=0.5, strip=strip.custom(strip.names=TRUE, strip.levels=TRUE,
var.name='age'))